Tracking slow network calls on msn.com
Improving performance is a never ending process. It is circular in nature with steps such as
- Collect data
- Measure & Compare
- Fix
- Repeat (Go back to step 1)
If you have the complete source code of your app, you are in a position to identify areas where you can potentially improve performance by making code fixes. But if you are running a website which has external content being injected (Ex : Advertisements), there is nothing much you can do it “fix” it. But it is a good idea to track them down, so you can do some actions (perhaps raise an issue with the ad content provider service).
Earlier this week, I decided to build a simple monitoring system which can give useful insights like how much time each network calls on a web page takes or How many calls are getting a 200 OK as expected or which call is the most slowest one etc. It consists of two parts
- The Data collector process: This is basically a simple node js app which fires up an instance of chrome browser and opens up a web page. I used the excellent googlechrome puppeteer npm package which offers a node js api to manage the headless chrome browser. The api has methods to track the network calls and the needed data will be persisted to a table for analysis and comparison
- The portal: A web app which reads the telemetry we collected and present to the user in different forms. Built with asp.net core 2.0.
My original plan was to throw the node js app as an azure web job and schedule it to execute every hour. But when I tried to upload the zip file, it was almost 70 MB and the web jobs could not accept anything more than 52468800 bytes(52 MB). (The puppeteer npm package downloads a recent version of chromium browser and use that. This itself is 70 MB(OSX)!)
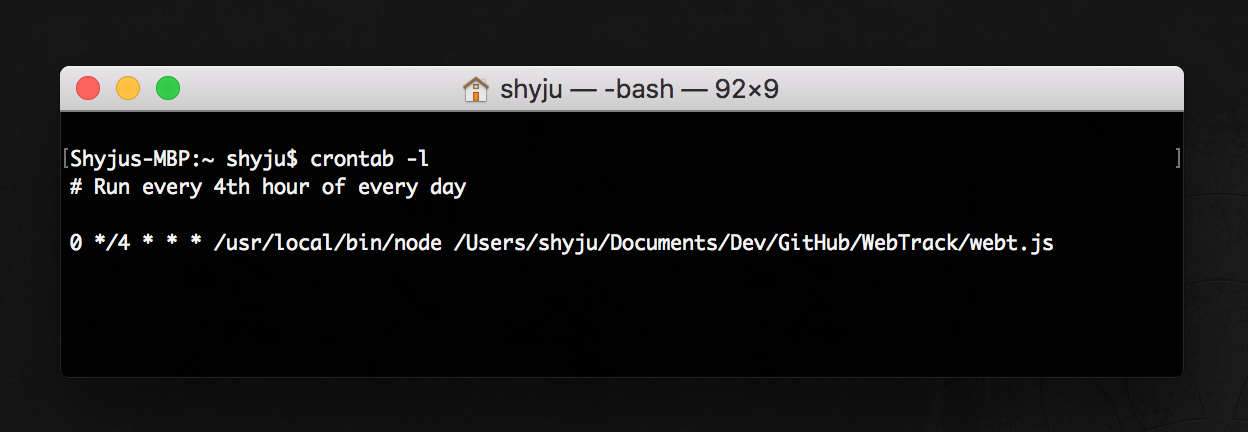
All I want to do is run a simple node js script. Why not do it from my machine ? So I created a cron job on my machine and scheduled it to execute the node js app.
Running some tests on msn.com
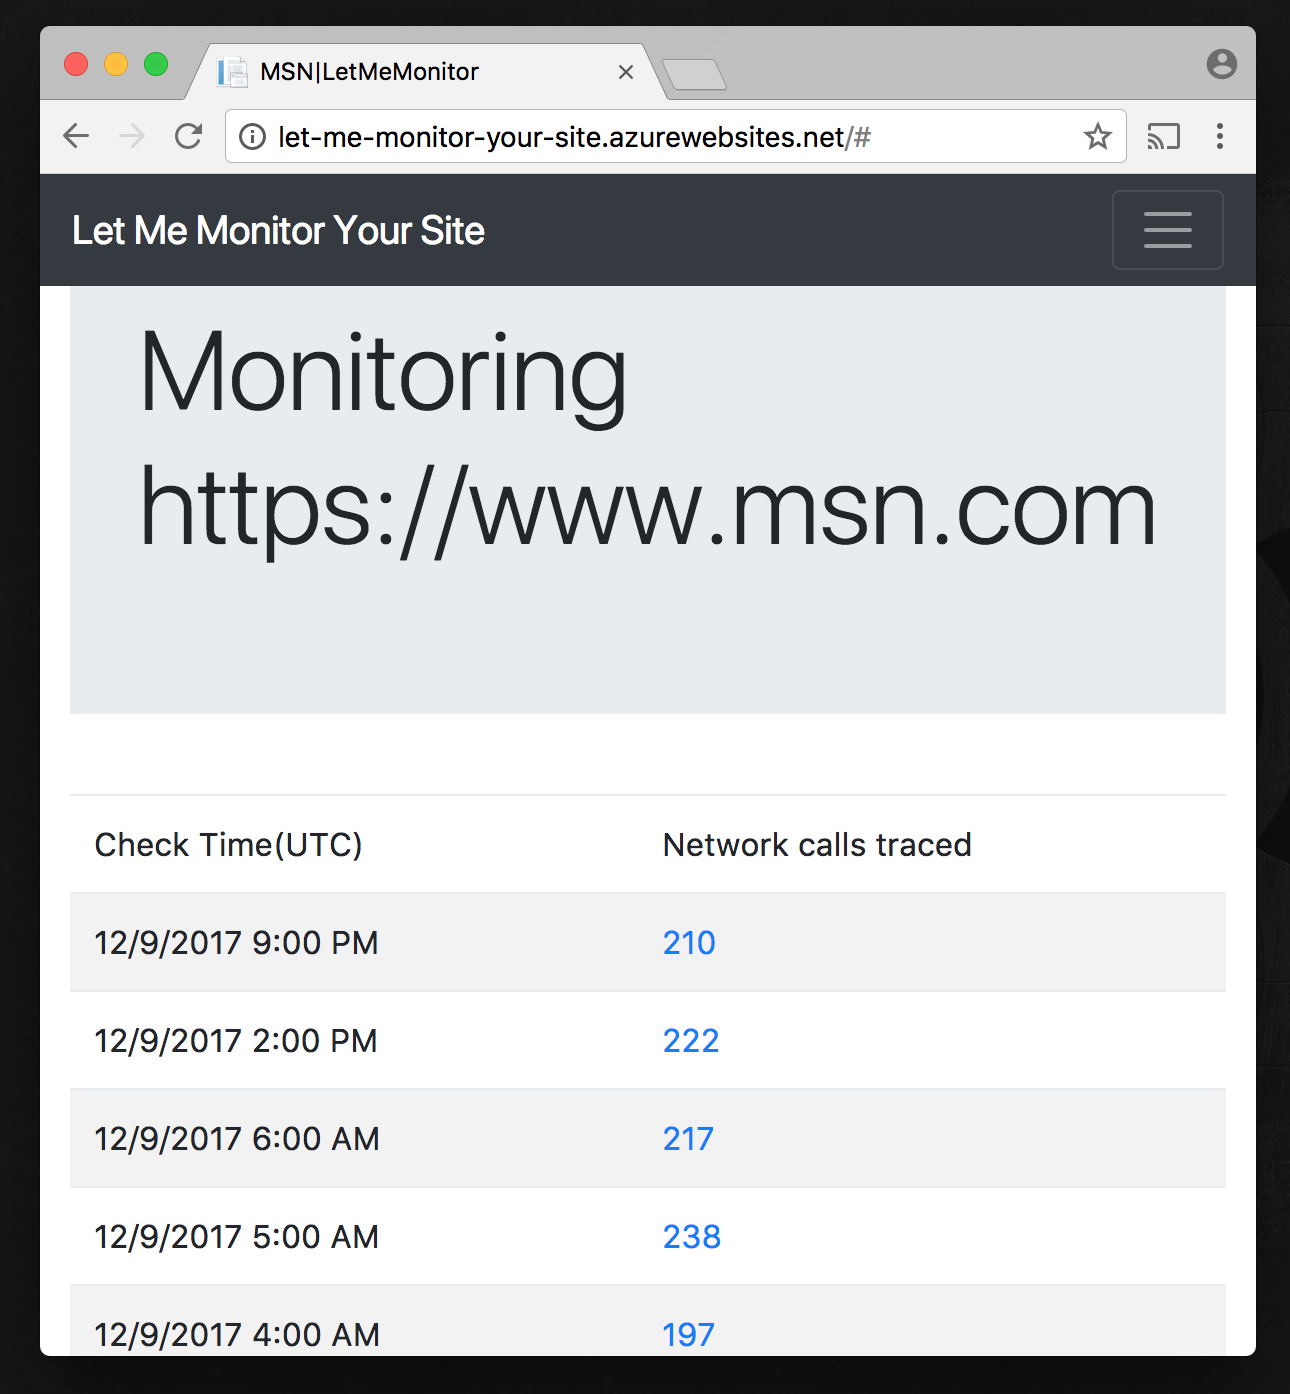
I decided to try it on msn.com as I noticed it has tons of external calls for the ads. I deployed the portal to azure as well. You can see it here http://let-me-monitor-your-site.azurewebsites.net
Ugh! Found some duplicate calls!
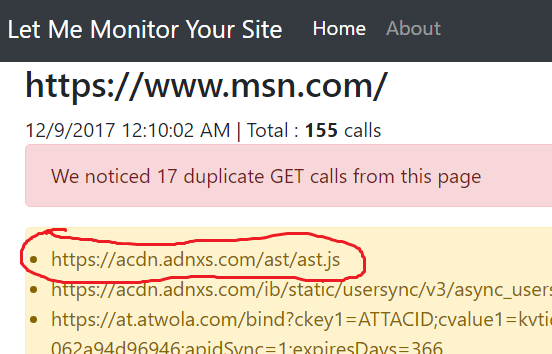
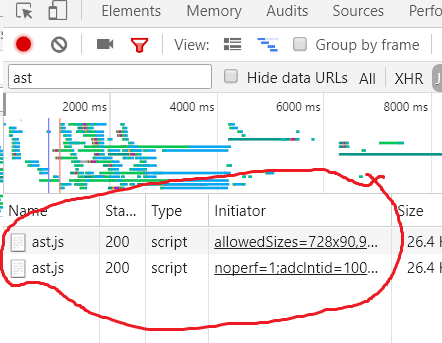
Yea! That’s right! double checked with browser devtools
Track the response time spikes / anomalies
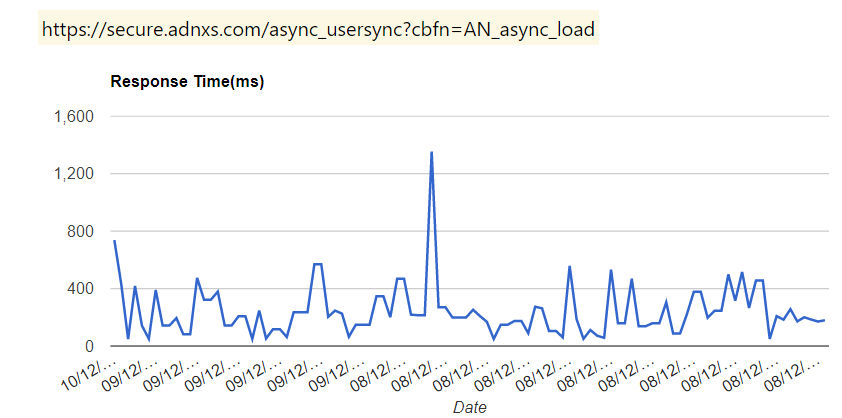
Some observations
Possibilities Puppeteer is opening to us: The google chrome team did an excellent job in building the puppeteer project. This project is going to make it easier to build automation testing of web applications, using just javascript! Take a look at https://github.com/GoogleChrome/puppeteer ❤️
Scheduled tasks: At the time of this writing, there is no direct way to setup a node js exe in windows as a scheduled task ( or atleast my reserch could not find one!). Fortunately, I had another machine running high sierra (which is a unix based OS) where I could setup a cron tab. It took a little bit of time for me to get used to setting up the job using terminal commands (I have been spoiled by GUIs)
Google charts : TBH,I am a chart /graph person .Visualization of data is more understandable than rendering some numbers. I chose to use google charts library to render the charts since i wanted something easy and quick. I would still love to see a single js file with relatively small size being downloaded to my page for rendering the charts.
Javascript talking to SQL server : I used the mssql npm package for the data access from node js. It has good documentation and does the job.
NPM Modules!!!!! : A picture is worth a thousand words.

Next Steps
The tool can be really useful if we add stuff like
-
Notifications when the behavior changes. One we collect enough data, we can compare new data against our existing data set and identify issues. For example, let’s say the call to
ast.jshas been always in the 200 to 400 ms range and if we get a abnormal response time (ex : 2 seconds), then we know something is not quite right. This can raise a flag/ notfication email to concerned team. - Record the response size. Similar to the response time, If the response size is exceeding a set threshold value, raise a flag/alert
- The api does not provide the initiator information for any calls as of now (there is an open issue on the GH repo for that). Capturing that information will be really useful.
Cheers